371.3 kW of peak demand, held to 57.3 kW
Six months of 15-minute interval data from a Ford dealership on Baltimore Gas and Electric rate schedule GL. Energy Guardian avoided $25,089.84 in demand charges by intervening in 2.6% of intervals. The numbers below are the actual meter readings, not a model.
Why this page exists
Every vendor in commercial EV charging claims load management saves money. Almost none of them publish the interval data. This page does, because the specific shape of the data is the argument: demand charges are set by a handful of minutes, so the fix is surgical rather than restrictive.
The single interval that pays for the system
On July 11, 2026 at 4:15 PM, site load was on track for a 371.3 kW peak. Guardian throttled charger output for that interval and the meter recorded 57.3 kW instead.
A demand charge is billed on the single highest interval in the period. One unmanaged interval sets the rate for the entire month.
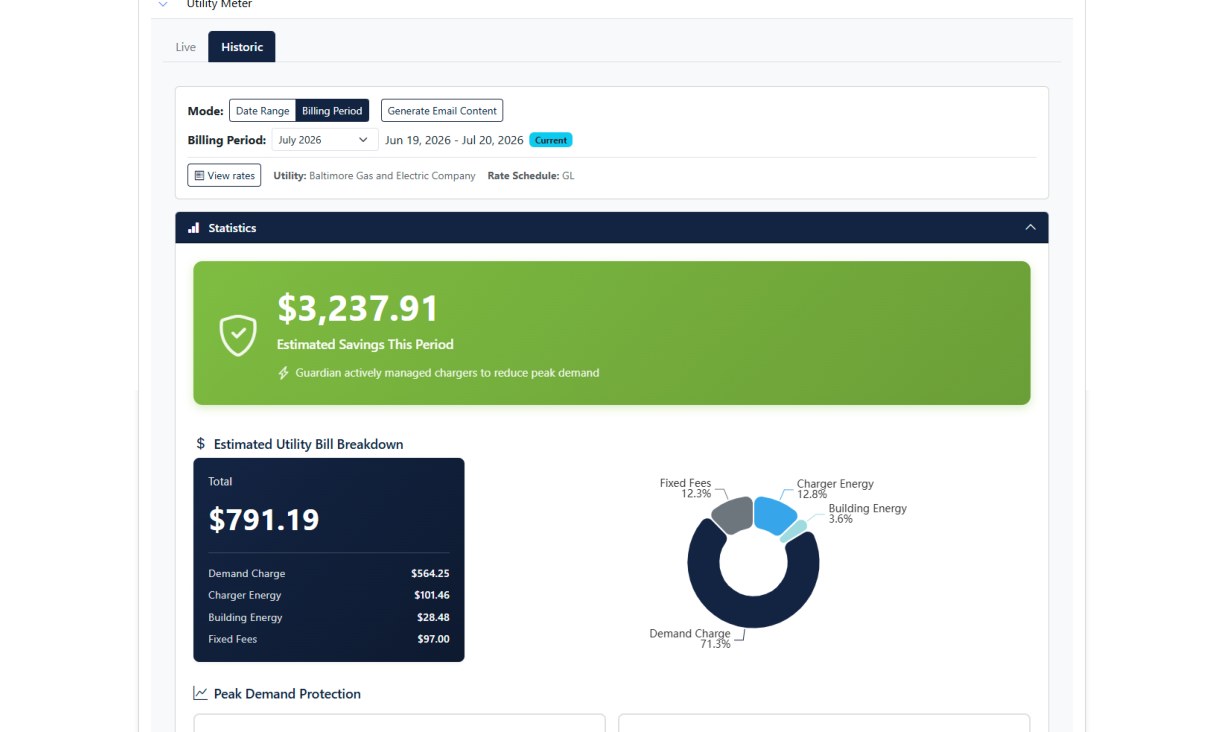
Guardian Historic view, billing period June 19 – July 20, 2026. Utility: Baltimore Gas and Electric. Rate schedule GL.
What the bill actually looks like
For the June 19 – July 20, 2026 period, estimated savings were $3,237.91. The resulting bill totaled $791.19 — and the composition is the part fixed-ops directors rarely see:
| Line item | Amount | Share |
|---|---|---|
| Demand charge | $564.25 | 71.3% |
| Charger energy | $101.46 | 12.8% |
| Fixed fees | $97.00 | 12.3% |
| Building energy | $28.48 | 3.6% |
| Total | $791.19 |
Electricity consumed — charger plus building energy — was 16.4% of the bill. The peak-demand penalty was more than four times the cost of the power itself.
2.6% intervention, not a charging restriction
Across the measured window, Guardian intervened in 18 of 687 intervals. For the other 669 intervals, chargers ran at full output with no management at all. That is the difference between demand-charge control and the blunt "charge only overnight" policies dealerships resist — the constraint applies to a few minutes a month, not to the customer standing at the charger.
Charger utilization over the same period was 1.4% across 101 sessions. That is the other half of the story: this site's demand-charge exposure was created by a small number of concurrent sessions colliding with the building's own load. Utilization does not have to be high for the bill to hurt — which is why sizing decisions made on expected utilization consistently understate cost.
How demand charges are calculated → · How Energy Guardian works →
What to take from this if you run a facility
Three things generalize beyond this dealership:
1. Your demand charge is set in minutes, not months. Pull your interval data and find your top five intervals. If they cluster in a predictable window — late afternoon, here — they are controllable.
2. Low charger utilization is not low risk. 1.4% utilization still produced a peak that would have been 371.3 kW.
3. Compare against unprotected demand, not last year's bill. The savings figure that matters is what the peak would have been, which only interval-level monitoring can establish.
Figures are drawn from Energy Guardian meter and charger telemetry for the periods stated. Savings are estimated against modeled unprotected peak demand at the applicable tariff rate, and will vary by site, utility, and rate schedule. Published with the client's permission.
What would your unprotected peak be?
Estimate the demand charge your chargers add — then see what Guardian holds it to. No signup to see your number.
Run the demand charge estimator →